
Drunk Driving Fatalities by State
Drunk Driving Fatalities by State
New data reveals the states with the most alcohol-impaired driving deaths. See where your state stands.Drunk driving remains one of the deadliest risks on the road. Using the latest data from the National Highway Traffic Safety Administration, we analyzed where drunk driving fatalities are most common, which states have improved, and where the problem is getting worse.
To do this, we calculated the rate of alcohol-impaired driving deaths per 100,000 residents in each U.S. state. These accidents involved at least one driver with a Blood Alcohol Concentration of 0.08 or higher — the legal limit in the United States. We then compared these figures to 2020 data to reveal where fatal crashes are rising or falling.
Understanding these risks is important for public safety awareness, but it also has widespread impacts for even the safest drivers (for instance, car insurance companies use local crash data when setting premiums). In areas with more drunk driving deaths, drivers may pay higher premiums, even if their own records are clean. Living in a high-risk state can affect both your safety and your coverage costs.
Key Takeaways
- South Carolina has the most drunk driving fatalities per 100,000 residents (7.1), followed by Montana (5.9) and Arizona (5.2).
- New Jersey has the fewest (1.4), followed by Utah (1.5) and New York (1.5).
- 25 states have seen a decrease in drunk driving fatalities, with Maine seeing the largest with a 38.6% drop since 2020. North Carolina fatalities have also decreased by 6.8%.
- Arizona has seen the biggest increase in drunk driving fatalities, with a 43.5% increase since 2020.
Which States Have the Most Drunk Driving Fatalities?
While drunk driving is a nationwide issue, the frequency and severity of fatal crashes vary significantly by state. This map shows the rate of alcohol-impaired driving deaths in each state by the number of fatalities per 100,000 residents. In 2023, South Carolina had the highest rate of drunk driving fatalities in the country, with 7.1 deaths per capita. Montana and Arizona were next with 5.9 and 5.2, respectively.
States With the Most Drunk Driving Fatalities per 100,000 Residents
- South Carolina (7.1)
- Montana (5.9)
- Arizona (5.2)
- Wyoming (5.1)
- Alabama (5.0)
- New Mexico (5.0)
- Texas (5.0)
- Mississippi (4.7)
- Arkansas (4.7)
- Tennessee (4.6)
States With the Fewest Drunk Driving Fatalities per 100,000 Residents
- New Jersey (1.4)
- Utah (1.5)
- New York (1.5)
- Massachusetts (1.5)
- Minnesota (1.6)
- Rhode Island (2.0)
- Alaska (2.1)
- Vermont (2.3)
- Pennsylvania (2.3)
- New Hampshire (2.4)
New Jersey reported the lowest rate at 1.4 deaths per 100,000 residents, followed closely by Utah (1.5) and New York (1.5). These states may benefit from stronger enforcement, better public transit options, or more effective public safety campaigns. North Carolina sat in the middle of the pack with a rate of 3.5.
States Where Drunk Driving Deaths Are Increasing
Looking at year-over-year change adds another layer to the story. While some states have made progress in reducing drunk driving fatalities, others have seen sharp increases since 2020.
States With the Highest Increases in Drunk Driving Fatalities
- Arizona (43.5%)
- Delaware (38.5%)
- Alaska (36.4%)
- Kansas (35.3%)
- Hawaii (34.6%)
- South Carolina (32.1%)
- Washington (30.0%)
- Nevada (27.9%)
- Alabama (21.5%)
- Iowa (15.8%)
States With the Biggest Decreases in Drunk Driving Fatalities
- Maine (-38.6%)
- West Virginia (-29.0%)
- Rhode Island (-21.4%)
- South Dakota (-21.3%)
- Montana (-20.2%)
- Wyoming (-18.9%)
- Wisconsin (-14.3%)
- New Mexico (-11.8%)
- Missouri (-11.1%)
- Utah (-10.5%)
Arizona had the most dramatic increase, with drunk driving fatalities rising by 43.5% over three years. Delaware and Alaska also saw significant rises, with increases of 38.5% and 36.4%, respectively. Other states showing big upticks included Kansas, Hawaii, and South Carolina (all over 30%).
On a more positive note, 25 states showed a decline in drunk driving deaths. Maine led with a 38.6% drop, followed by West Virginia (-29%) and Rhode Island (-21.4%). Even states like Montana and Wyoming, which still rank high in fatality rates, saw double-digit decreases, suggesting some improvement despite ongoing risk. North Carolina also showed a 6.8% decrease, reinforcing a positive trend even as certain counties within the state continue to face challenges.
North Carolina’s Most Impacted Counties For Drunk Driving
While statewide data offers a broad picture, local trends can show where drunk driving hits hardest. Guardian Service is based in Raleigh, so we wanted to take a deep dive into how North Carolina is tackling drunk driving in the state. Some counties stood out for having higher numbers of alcohol-impaired driving fatalities.
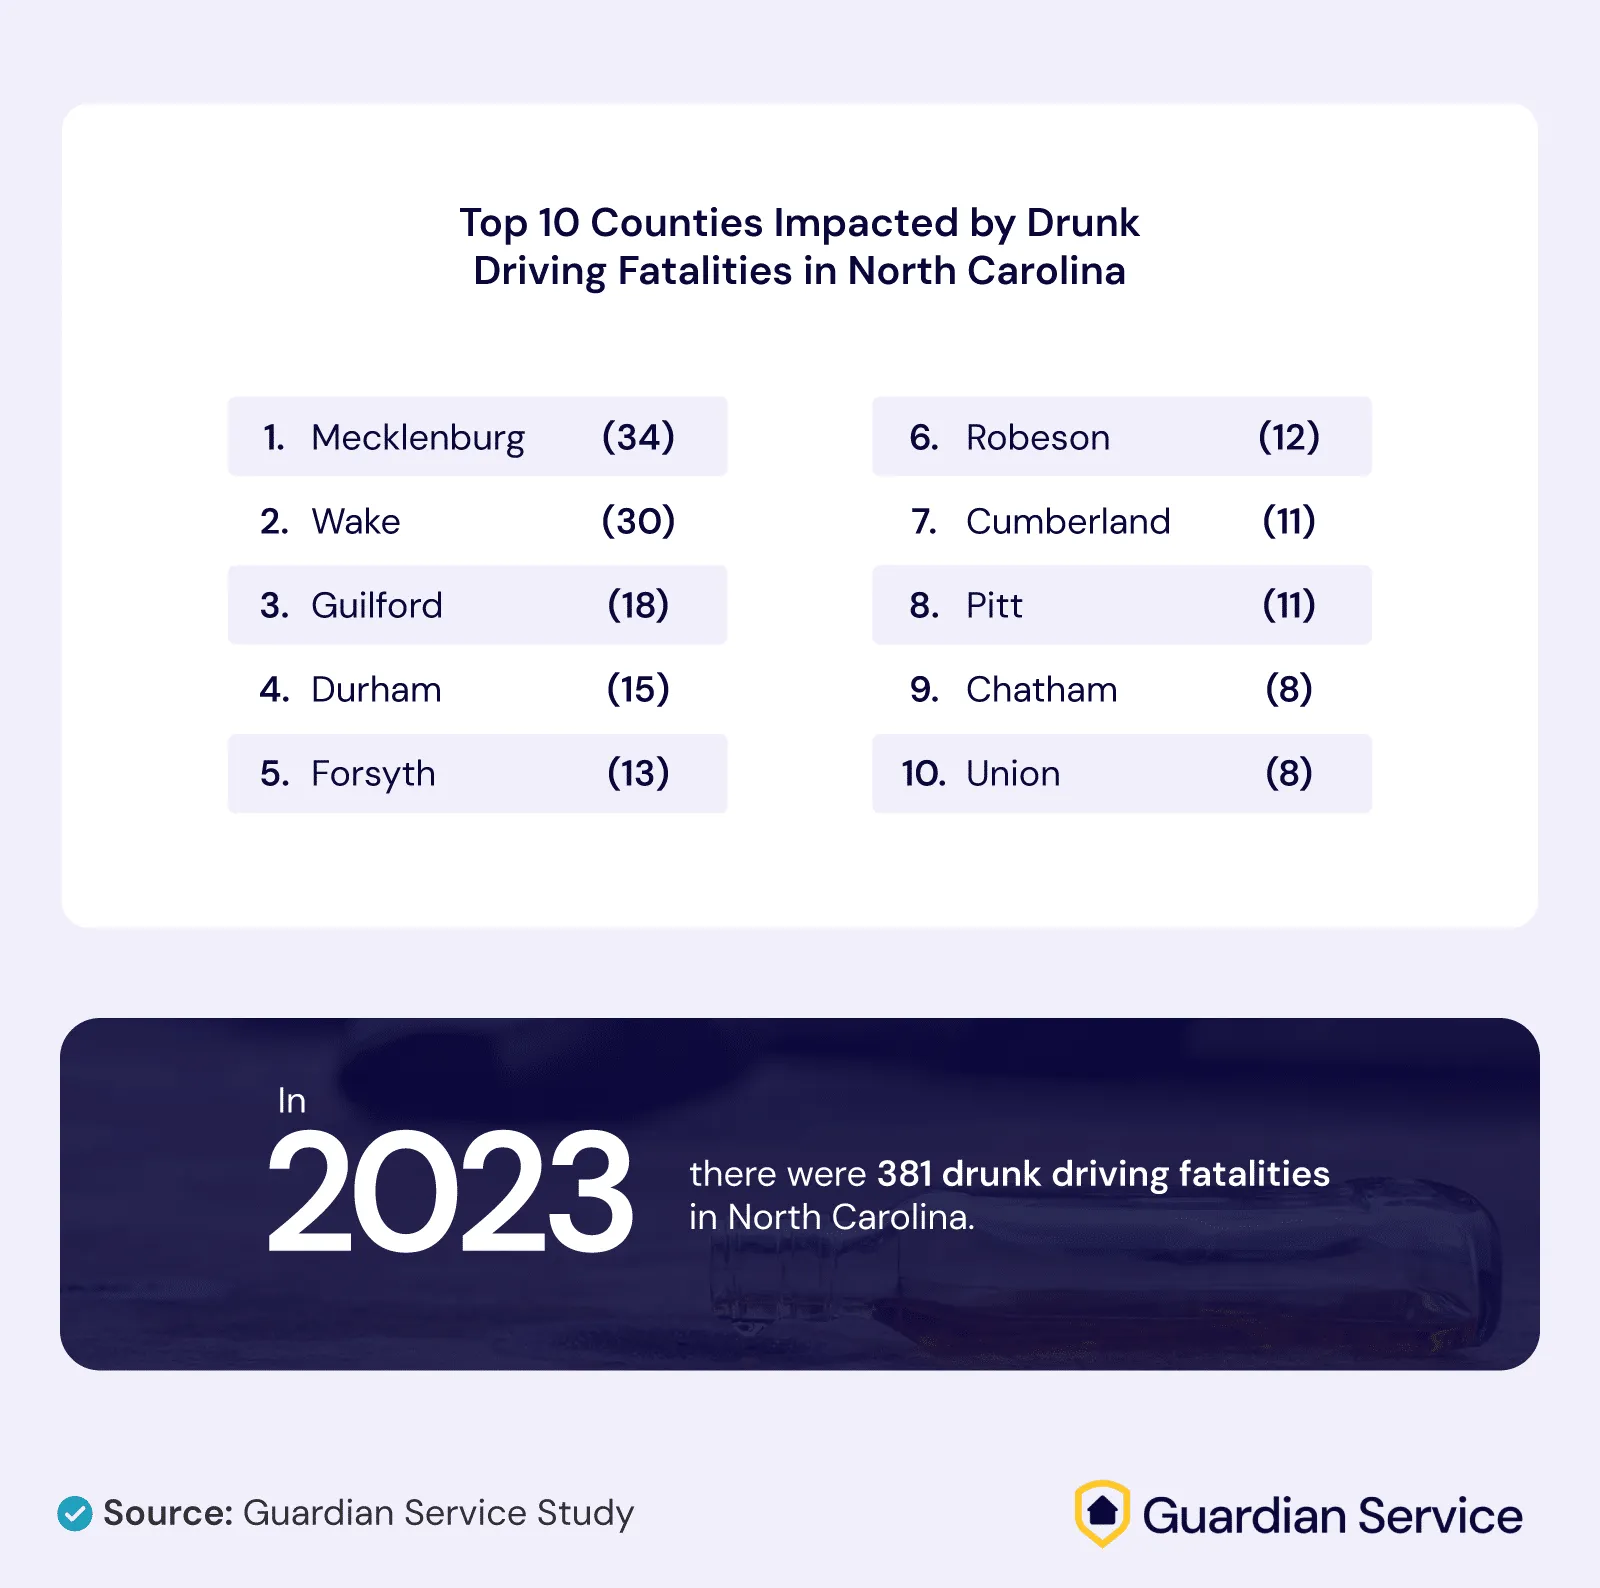
In 2023, there were 381 drunk driving deaths across North Carolina. The counties with the highest totals were:
- Mecklenburg County (home to Charlotte): 34
- Wake County (home to Raleigh): 30
- Guilford County (home to Greensboro): 18
These counties are among the most populous in the state, which contributes to higher traffic volumes and, potentially, more alcohol-related crashes. Still, the numbers suggest a need for targeted awareness and enforcement efforts in high-impact areas.
Conclusion: What This Means for Drivers
Drunk driving remains a serious threat, and its impact can vary widely depending on where you live. Some states have successfully curbed this issue, while others are dealing with a growing problem. For drivers in high-risk states with rising fatality trends, it’s especially important to be vigilant and prepared for the unexpected while on the road. That includes not just driving responsibly but also carrying the right car insurance in case you’re ever affected by someone else’s poor choices.
In areas with higher accident rates, insurance premiums may reflect increased risk. But coverage also matters when it comes to protecting yourself financially after a crash, whether that means paying for repairs, covering medical costs, or handling legal claims. The more you know about your region’s risks and the coverage provided by your policy, the better equipped you’ll be behind the wheel.
Methodology
We analyzed the most recent publicly available data from the National Highway Traffic Safety Administration’s (NHTSA) Fatality Analysis Reporting System (FARS), using the 2023 dataset to assess the impact of alcohol-impaired driving across U.S. states.
To measure the prevalence of drunk driving fatalities, we focused on crashes involving at least one driver with a Blood Alcohol Concentration (BAC) of 0.08 grams per deciliter (g/dL) or higher. This BAC level represents the legal threshold for alcohol impairment in the United States, as defined by the NHTSA. Any fatality involving a driver at or above this level is classified as alcohol-impaired under federal standards.
Our analysis calculated the rate of alcohol-impaired driving fatalities per 100,000 residents in each state. We also compared the 2023 data to figures from 2020 to identify trends and highlight where drunk driving deaths are increasing.
About Guardian Service
Guardian Service makes car insurance simpler, faster, and less frustrating. Unlike traditional providers, our zero-commission agents help you compare top-rated plans, switch providers easily, and even re-shop your policy each year to make sure you’re always getting the best deal. Whether you’re looking for basic coverage or a plan with added protection, we help you stay insured without the usual hassle.
Fair Use Statement
We encourage the noncommercial sharing of this content for educational or public awareness purposes. If you reference this study, please link back to Guardian Service and credit us as the original source.